What happened this year in the global investing environment? What should you expect in the year ahead? Are fears of a flattening yield curve warranted? Learn what you can do as an investor.

In 2019, political and trade drama will probably continue to generate short-term noise in the markets, but economic trends (not market ups and downs) ultimately determine medium and long-term returns.
If you chose the right risk level, short-term volatility is not something that should worry you. If it does bother you, then the risk you’re taking is too high.
Inflation-adjusted growth in the US continues to perform better than the global aggregate. This means that investors should continue to invest internationally and will need a sufficient amount of US-based assets to enhance the staying power of their portfolios.
A closer look at the last two bear markets reveals that they didn’t happen when the yield curve is flat (or inverted). Instead, these bear markets actually happened when the yield curve stopped flattening and “re-steepened” after the inversion! The reality is that past economic cycles have shown us that yield curve inversions were not a reliable recession timing tool: stocks can continue to climb substantially and for a long time well after the inversion.
Contents
Political Drama
Two stock market corrections in a single year pretty much summed up 2018’s investing environment. Much of the market volatility has been generated by never-ending geopolitical drama. Beyond trade tensions, there are also geopolitical uncertainties such as Brexit, the ongoing budget tension between the EU and Italy and calls for sanctions on Saudi Arabia after the murder of journalist Jamal Khashoggi.
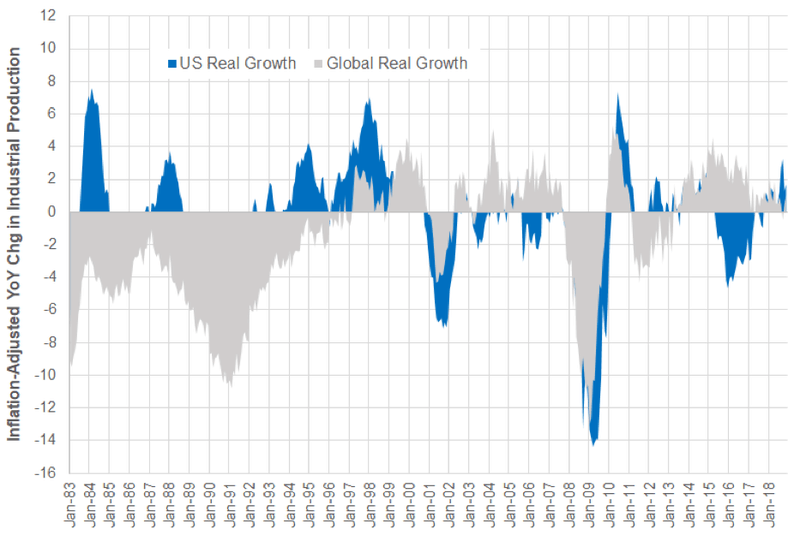
In 2019, political and trade drama will probably continue to generate short-term noise in the markets but economic trends ultimately determine medium and long-term returns. Long-term investors should continue to focus on macroeconomic data. In particular, inflation-adjusted growth (otherwise known as “real” growth) is a very important gauge. As can be observed in Figure 1, inflation-adjusted growth in the US continues to perform better than the global aggregate. This means that investors should continue to invest internationally but will need a sufficient amount of US-based assets to enhance the staying power of their portfolios.
A Subdued 2018
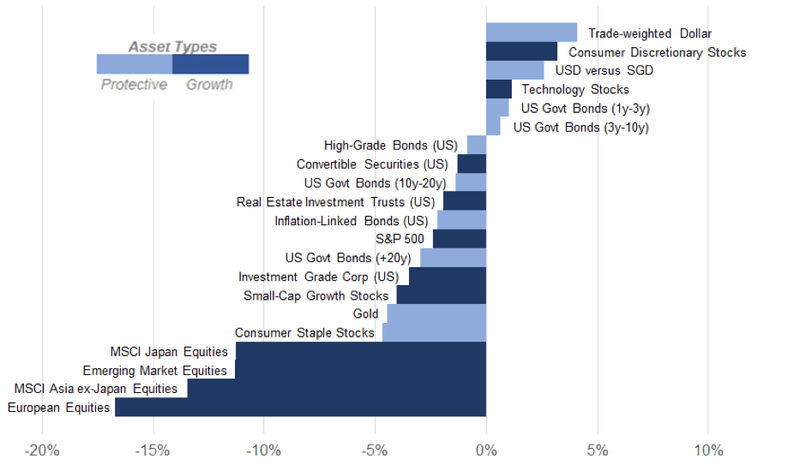
Figure 2 shows the YtD total returns (before fees) of some of the asset classes we’ve tracked throughout the year. The chart is based on the closing data on 18 December. Growth-oriented assets are indicated by dark blue, and protective assets by light blue.
The best performers among growth-oriented assets are stocks in the US consumer discretionary and technology sectors. As of 18 December, they have gained YtD returns of +3.2% and +1.2%, respectively. While these returns are a far cry from the double digit gains in 2017, they are significantly better than the ones achieved by equity markets in Japan, Emerging Markets, Asia ex-Japan, and Europe where YtD returns range from -16.7% to -11.3%. These regions have a large dependency on China, so understandably have reacted more negatively to the existing slowdown in China that was worsened by this year’s trade war.
Misguided Yield Curve Fears
The yield curve is a plot of bond yields against the amount of time they have until they mature. If one plots the yields of government bonds against time to maturity, the plot is known as a government bond yield curve.
When the banking system is functioning properly (without distortions from policy or any other factors), the yield curve tends to be upward sloping. In this environment, lenders, such as banks, would be happy to borrow in the short-term (by accepting deposits from savers) and make longer-term loans (5 years and longer) as they enjoy profitable net interest margins. On the other hand, borrowers face higher costs in borrowing long-term and would tend to favor shorter-term loans and be ready to roll them over when expired.
Economic theory suggests that a very flat (or inverted) yield curve could lead to a recession, and this has become quite a hype in the media. When the yield curve is very flat or inverted, lenders have fewer incentives to make long-term loans because the returns in doing so are low relative to the their cost of capital (which is indexed to short-term deposit rates). As a result, banks tend to tighten their lending standards. This, in turn, shuts out a lot of borrowers from the credit market, and could be negative for economic activities.
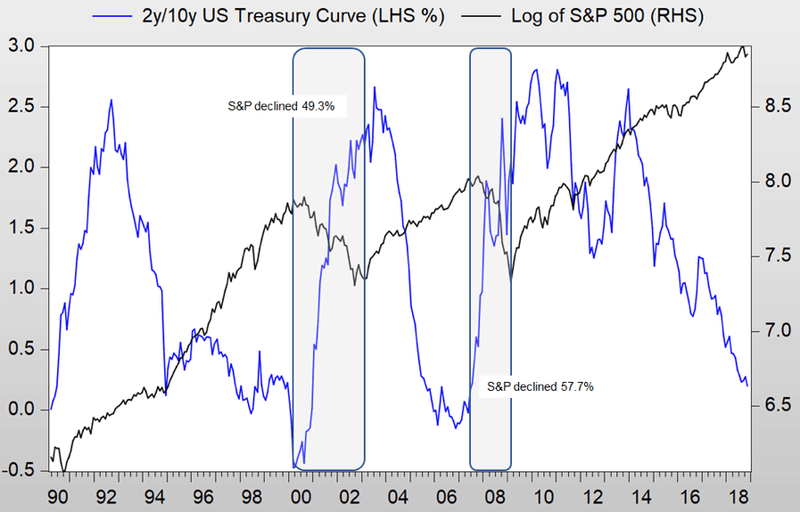
Let’s take a look at some data in Figure 3. Over the last 18 years, we have witnessed two major bear markets for equities. The first bear market took place after the bursting of the US technology bubble (March to October 2000), when the Nasdaq Composite and the S&P 500 declined by around 78.4% and 49.3%, respectively. The other bear market happened during the housing market crisis of 2008. During that time, the S&P 500 declined by around 57.7% between November 2007 and March 2009. A closer look reveals that these bear markets did not happen when the yield curve flattens. Instead, these bear markets actually happened when the yield curve stopped flattening and “re-steepened” after the inversion! The reality is that past economic cycles have shown us that yield curve inversions were not a reliable recession timing tool: stocks can continue to climb substantially and for a long time well after the inversion. Taking these signals too literally can be costly to investors.
Fed’s Yield Curve 2019
The right yield curve to look at is a plot of the market’s expectation on Fed’s interest rate over time. This is known as the Fed funds curve, and when it slopes upward, that means that the economy is doing well enough that the market thinks rate hikes are justified. When there is a lack of confidence in the economy, the market will start to anticipate rate cuts from the Fed to smooth out the path of the economy. In this case, the Fed funds curve could invert. As this situation is recessionary in nature, growth-oriented assets tend to underperform. In other words, the Fed funds curve is a forward-looking indicator of the economy.
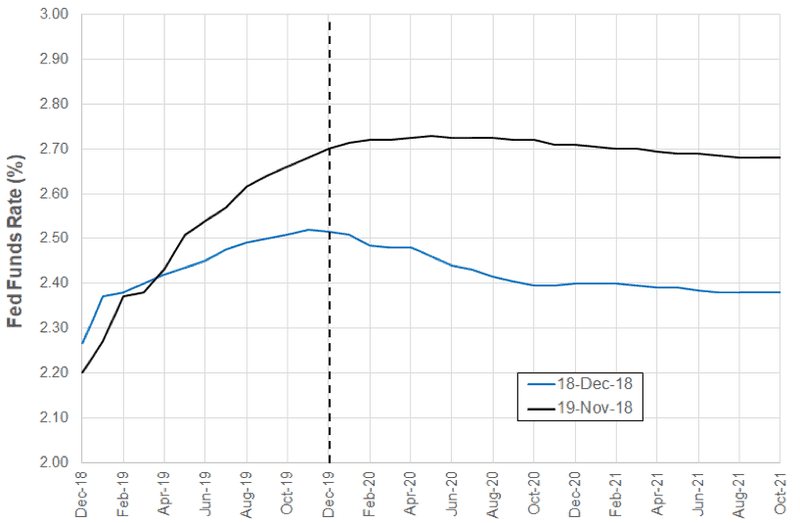
At the time of this writing, the Fed funds curve is pricing in a 0.25% rate hike by June 2019. In addition, there is also a 26% chance that the second rate hike could be delivered by December 2019 (Figure 4). This expectation is less aggressive than what we have observed on 19 November when two full rate hikes by December 2019 were priced in.
So the market has pared back its earlier confidence about the economy to a more measured level. The Fed funds curve is far from being inverted and should not be confused with an expectation for a recession. What you need to know is that the market is lowering its expectations on the returns of growth-oriented assets in 2019. This is healthy as it reduces the risk of future earnings disappointment. It also means that market valuations are fairer.
It is important to keep in mind that portfolios should continue to be diversified and have a sufficient amount of protective assets, such as US government bonds, high quality corporate bonds and gold. The slower expected pace of rate hikes helps these protective assets function more effectively as shock absorbers for a portfolio.
What Should Investors Do (or Not Do)
The most important thing to navigate volatile markets is to stick to your plan. Don’t try to time the market, but rather, invest systematically (e.g., monthly) through standing instructions, and confirm that the risk level you have chosen is right for you and does not disturb your sleep! How can you stick to your plan? Ignore the media and maintain a long-term mindset.


Leave A Comment