How is the US equity market performing? Did you sell in May and go away? Join us to look at market and indices performance. And gain insight on what this means for the individual investor.

The markets of May have become associated with the saying “sell in May and go away”.
Coincidentally the trade war (which was growing cold) heated up with a tech war commencing. US president Trump signed an executive order on 15th May 2019 restricting Chinese telecommunication firms from selling their equipment in the US including Huawei Technologies and ZTE.
Contents
Market and Indices Performance
We take a moment to check where the market is situated in at this juncture of time.
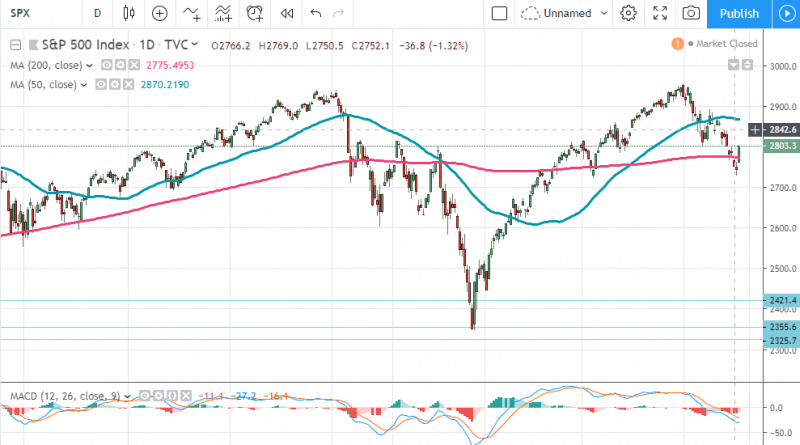
S&P 500 Index
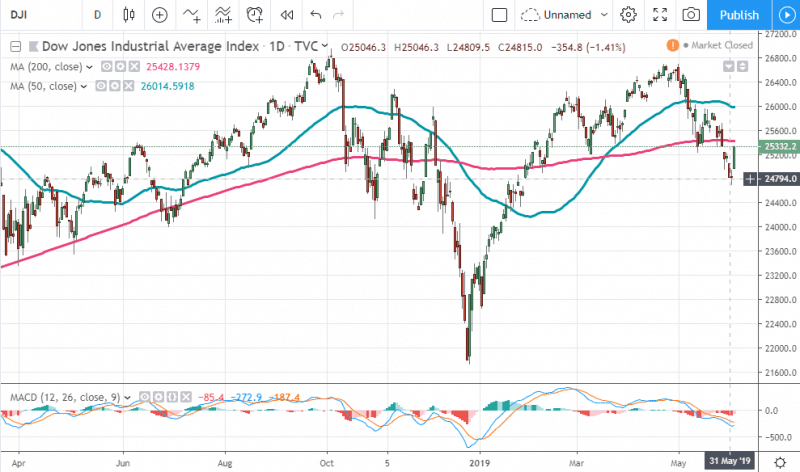
Dow Jones Industrial Average Index
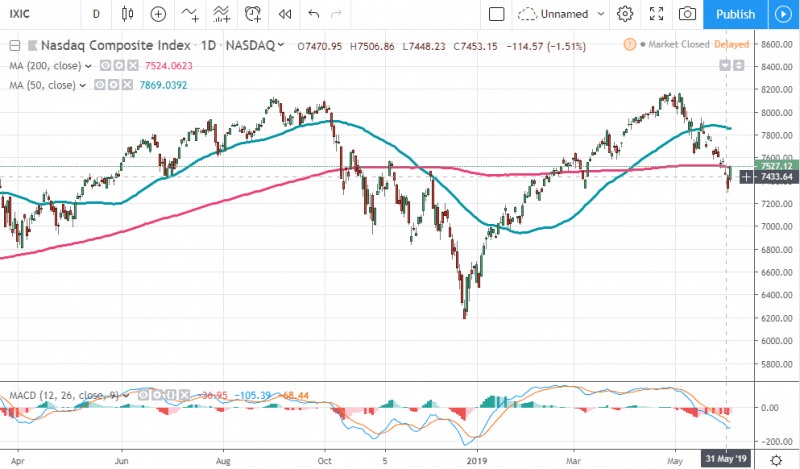
Nasdaq Composite Index
The daily closing price of the 3 major monitored indices are below the 200-day simple moving average (SMA). This means the market has turned from a long term uptrend into a long term downtrend. But there is another crucial signal that we have not seen yet which is when the 50-day SMA crosses to the downside of the 200-day SMA, aka the ominously name Death Cross. If this happens, it will take just a few more weeks of weakness in the market for this relationship to turn negative – signalling a serious bear market.
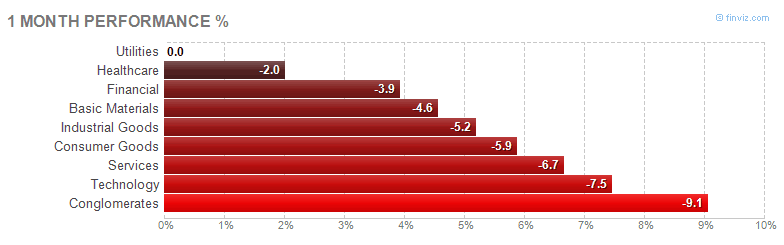
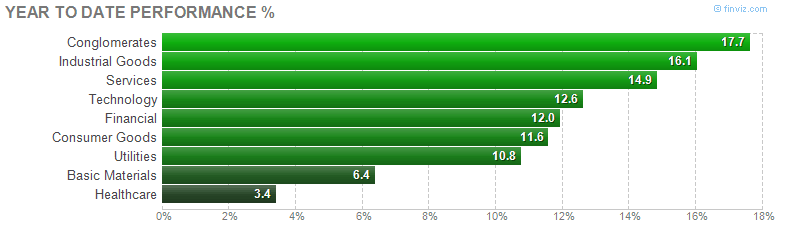
Market Sector Performance
The sectorial performance for the last month and year to date is included for easy reference. We see which sectors have been doing well (or at least less bear-ish). This sector information is useful as well for investors who are looking to adjust their stock portfolio in the quarter ahead.
The SPX hit an all-time high. Investors digested the trade-talk latest development with White House Chief of Staff Mick Mulvaney saying that the Trump administration’s trade talks with China will be resolved within the next two weeks. The majority of S&P 500 companies topped analyst expectations, which was a good start heading into May.
Stocks fell in early May after Federal Reserve officials hinted at rate changes. The data released showed the core personal consumption expenditure price index remained unchanged in March and was up 1.6% YOY, but below the Fed’s 2% target. This in turn was tempered by strong US job creation and positive market sentiment with Warren Buffet’s investment in Amazon.
The overall impact of a global trade war is expected to cost a decline of -2% GDP growth. Trump however is pushing for a rate cut and observers of the Fed are looking at an increasing likelihood of this happening. Federal Reserve Chairman Jerome Powell signaled that the central bank was open to easing monetary policy to save the economy.
Market and Investors
Investors may want to be extra careful on entering a market which is near highs. Buying a stock at an expensive price may affect your returns. Or as Warren Buffett puts it:
“It’s far better to buy a wonderful company at a fair price…”
Investors may also want to focus more on selected sectors such as utilities, consumer staples, and companies who focus domestically. Sectors which are at high risk from a global trade war are technology companies, industrials, and companies which derive a significant portion of revenue from China.
Having cash ready is prudent as well to take advantage of any opportunities that may arise to buy wonderful companies at a fair price. Take measured steps and stick to your well-defined personal investment plan.
Overall, investors should think like a fox but act like a hedgehog. A fox is one who knows a little about a great many things like equity markets, forex, and the global economy. While a hedgehog focuses only on a few select areas but knows them well aka your circle of competency.


Leave A Comment