We review what’s been the global financial impact of Trump’s recent actions and what does it mean for you. The original version of this article was published on StashAway.my.

On 31 May, President Trump used his notorious tariff scare tactic to intimidate the Mexican government into stopping immigrants from entering the US illegally.
This latest tariff threat completely surprised the markets, as they were still fixated on watching the dust settle in the east after the most recent breakdown of the US-China trade negotiation. Fortunately, the markets caught a break when Trump drastically (yet not unexpectedly) rescinded the tariff threat the moment he got his way with Mexico. In exchange for no tariffs, Mexico will expand deployment of its national guard, prioritize managing its northern border, and ensure that asylum seekers who cross into the US will quickly be returned to Mexico where they’ll wait for their claims to be resolved. Turns out, the US’s access to avocados and tomatoes was never in danger. Enjoy the guacamole, America.
Although this tariff scare likely won’t have a direct impact on the markets or economy, these latest “negotiations” could mean that the United States–Mexico–Canada Agreement, or USMCA, may now have an even greater uphill battle for securing Congressional approval. This will also likely lead to economic disruption to international trade, as the mistrust wrought by Trump’s erratic trade tactics will have longer-lasting effects around the world. Companies are already holding back on investments that involve the US in their supply chains, as they’re wary of the uncertainty that Trump’s trade strategy brings.
Ultimately, there’s only one way to interpret this: Trump will continually use tariff threats as his weapon of choice to get whatever he wants. This was a matter of immigration, not the economy or trade deficits, yet somehow, he managed to introduce tariffs into immigration reform. Trump has even admitted that this new round of tariff threats with Mexico had nothing to do with trade, but rather was a way to address illegal immigration through Mexico.
The world is watching, and is growing increasingly cautious about how it interacts with the US. After all, this may be a new world order where any country can be slapped with tariffs whenever the Trump administration is unhappy with something.
As long-term investors, it’s important that we understand what’s meaningful and worth paying attention to (and what’s not), especially when the media around the world world are overstating the effects of an event on the markets.
Contents
Markets are still recovering from US-China riffs
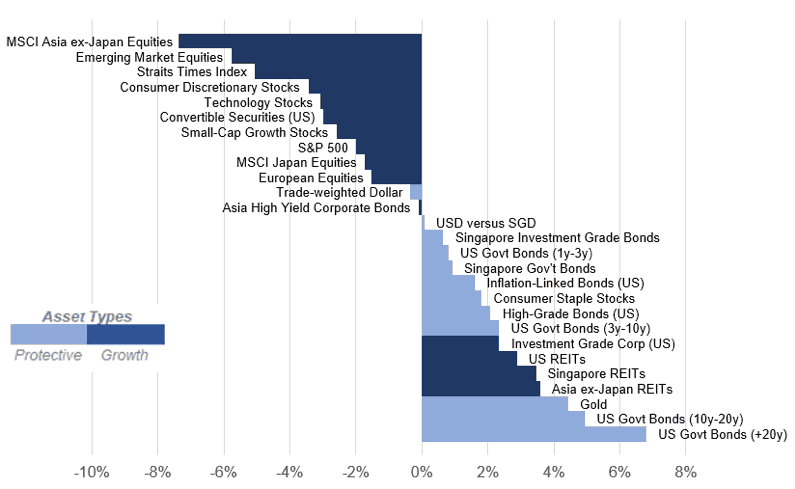
Despite the relief rally, most growth-oriented assets have yet to fully recover from the breakdown in US-China trade talks. At the time of writing, the S&P 500 is roughly 2% below its high of 2,946, and protective assets have outperformed. As shown in Figure 1, Asia ex-Japan remains the laggard, as a large proportion of its market value is exposed to trade-sensitive nations, such as China and South Korea.
Amid the market tumult, US government bonds attracted a lot of safe haven demand from investors. Additionally, central banks’ pledge to ease monetary condition have further compounded investors’ demands for high-quality protective assets. US government bonds with maturities greater than 20 years have outperformed with an impressive 6.8% return. This demand for safety also helped real estate investment trusts perform, as this asset class tends to gain when yields are lower. REITs in the US, Singapore, and Asia ex-Japan have delivered positive returns of 2.9%, 3.5% and 3.6%, respectively.
Asset class performance between 30 April 2019 and 7 June 2019
Does the US-China trade war matter?
As Nobel Laureate Professor Paul Krugman has opined in his column at the New York Times [1], the short answer is “No, they don’t”. As Krugman has explained, “in the short run, a tariff is a tax. Period. We’re still talking, at least so far, about a tax hike that is only a fraction of a percent of GDP”.
How much could this “fraction of a percent of GDP” potentially impact the stock market? To answer that question, let’s explore the potential economic damage on the US economy, since American consumers are the ones paying the majority of trade tariffs.
We need to make three important assumptions to calculate potential impact, and we’ll look at “worst-case scenario” from a trade-war perspective:
- Assumption 1: Donald Trump gets re-elected in November 2020.
- Assumption 2: President Trump’s successor from the November 2024 general election will be eager to undo his trade policies, but will take 2 years to effectively do so.
These first two assumptions give us a total of 7 and a half more years of trade disruptions.
- Assumption 3: Trump imposes a 25% flat rate tariff on all Chinese imports. This rate is worth $125 billion USD per year, and is equivalent to about 0.594% of the annual GDP of the US economy.
With these plausible worst-case scenario assumptions, we would be looking at 7 and a half years of full-blown tariffs on all Chinese imports that would amount to a cumulative cost of 4.455% of US GDP (= 7.5 * 0.594%). According to our statistical analysis, this hypothetical 4.455% loss in GDP would result in a cumulative 9.088% loss in industrial output [2].
The stock market would most certainly price in this loss in industrial output, but it also would have to consider the negative “spillover”, or secondary chain reactions, such as corporates delaying their hiring decisions, pushing back plans on capital expenditure, and so on. These secondary effects could in turn result in a total loss of 13%-18%% for the S&P 500, based on the statistical relationship between YoY percent changes in the S&P 500 and industrial production. In practice, market outcomes are rarely as precise as a point estimate so the impact on the S&P 500 could be anywhere in between 13% and 18% [3].
Potential Impact of a Full-Blown US-China Trade War on S&P 500
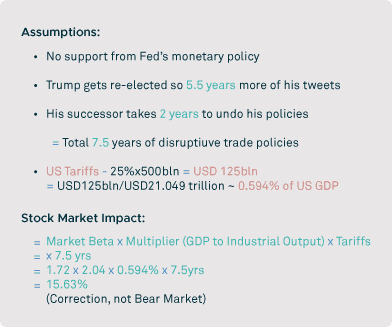
(Assumes no Central Banks’ Support)
* In practice, the S&P 500 is more likely to react with some deviations around the above point estimate. In this article, we use a +/- 2.5% band around the 15.6% figure.
Keep in mind that any temporary market decline of less than 20% is a market correction, not a bear market. These assumptions may seem extreme, and that’s precisely the point: even the most extreme realistic assumptions still result in a potential fallout that is well within the confines of only a typical market correction. This is not to say a bear market is impossible; it’s plainly to say that these trade disputes would not be the cause.
In other words, it’d take a lot more than the US-China trade war to bring about a bear market. Plus, global central banks are now gearing up to prepare their economies in order to make it much more difficult for a recession to materialize due to a trade war. So let’s look at that, too.
Central banks are gearing up to cushion their economies
Outside the US, slowing growth and low inflation have become common features in many economies. This trend leaves room for the central banks of these economies to ease monetary conditions: the US Federal Reserve, along with the Reserve Bank of Australia, Bank Negara Malaysia, and Reserve Bank of New Zealand, have expressed their readiness to support their respective economies by cutting interest rates.
How much would central banks have to cut interest rates to offset the value loss from a full-blown US-China trade war?
According to our estimates, a hypothetical 1% reduction in the average of short-, medium- and long-term US interest rates (say, through four rate cuts of 0.25%) can provide nearly 13% [4] boost to the price of the S&P 500. To achieve an offset against 13%-18% of potential damage within our hypothetical scenario in Figure 2 (see above for Potential Impact of a Full-Blown US-China Trade War on S&P 500), the Fed would probably need to lower the average of short-, medium-, and long-term interest rates by 1.0% to 1.4%. With US government bond yields currently ranging from 1.88% for 2-year maturity to 2.62% for 30-year maturity, there’s room for monetary policy to achieve this target amount of rate cuts.
Quick history lesson:
This scenario relies on the assumption that we do not repeat the scale and scope of the global trade war seen during the Great Depression. Back in the 1930s, there was a lack of understanding of international trade, and many policymakers misperceived tariffs as a tool that can improve trade and therefore lift one’s economy above another. During the Great Depression, it was not just the US slapping tariffs on imported goods from the rest of the world; other countries were also slapping each other with retaliatory tariffs. In the US alone, tariffs were at one point hiked to as much as 60% for almost 20,000 imported goods [5]!
Today, Trump’s political aspirations limit his effect on the global economy
Today, as volatile as President Trump’s tweets have been, it would take exponentially more escalation than what we’ve seen thus far to get to the level of tariffs seen during the Great Depression. The US will most likely continue focusing its trade war squarely on China, and it’s highly unlikely that the Trump administration would take on the same fight seriously with anyone else. The recent drama with Mexico and its swift resolution is a good example of how the trade fights aren’t serious.
If Trump wants to get re-elected, he will need a stellar scorecard on the economy and markets. If he instigates any more serious trade wars, that could hurt the economy, and therefore hurt his chances of getting re-elected. As shown by the following figure, Trump’s approval rating has been highly correlated with the S&P 500. His actions may seem random, but they’re actually strategic and ultimately driven by political calculations, and so he won’t do something that compromises his long-term approval rating.
Trump’s Job Approval Ratings* Are Highly Correlated to the S&P 500
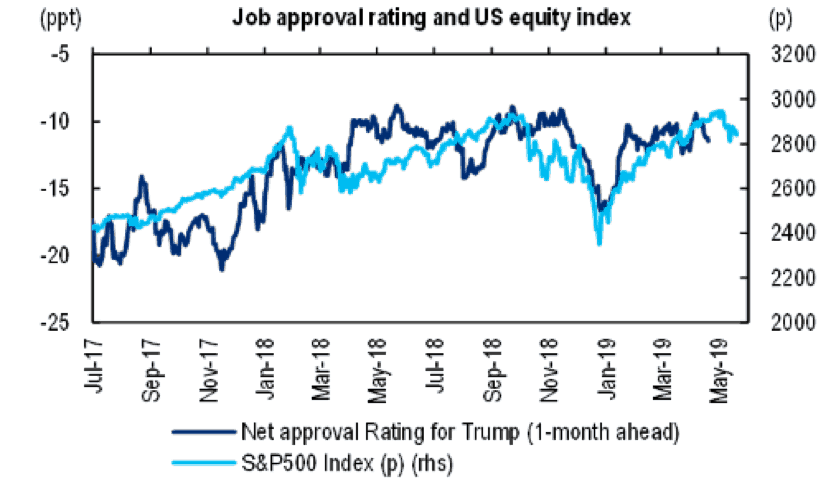
(Source: Fivethirtyeight, Bloomberg, Citi Research)
* Net=“approve minus disapprove.” Correlation is 72% when we lag S&P 500 index by 1 month from Jul17-Jan19. Represents Citibank’s opinions. Subject to change. As of May 28, 2019.
What should you do?
Nothing, just stick to your plan.
With the market as sensitive towards Trump’s antics as it is, short-term volatility isn’t going to go away. But, the economy is still strong and persistent.
In times of increased market volatility, it’s good to make an honest assessment about the risk level you’ve chosen for your investments: Are you calm, relaxed, and not worried about the constant news flow and ups and downs of your portfolio? Or are you constantly checking your investments and feeling stressed by your short-term performance? If the latter is the case, you should adjust your risk exposure so you can stop worrying about it. By having investments within your risk comfort-zone, you prevent yourself from making the mistake of potentially selling at the wrong time. This is the approach you need to take for long-term investing success.
The main lesson for us here is to continue to invest our savings according to our predetermined investment plan: don’t freak out when markets are down, and don’t get overly excited when they are up! When the market is down, our regular contributions purchase us more units of the underlying assets. When the market is up, our regular contributions buy us less units. In the end, the act of averaging into the market over time reduces the ups and downs to our net worth. So let’s tune out the noise from President Trump and the media alike, and continue to focus on improving the other aspects of our personal lives.
References
- Professor Paul Krugman’s opinion column at the New York Times (11 May 2019), “Killing the Pax Americana – Trump’s trade war is about more than economics”.
- Based on the statistical relationship between yoy percent changes in GDP and industrial production, we have estimated that industrial output could react to GDP at a multiple of 2.04x.
- We have examined the statistical relationship between yoy percent changes in the S&P 500 and industrial production. For every 1% annual loss in industrial output, the S&P 500 could react with a 1.72% decline. This also means a 9.088% loss in industrial output could lead to a 15.63% decline in the S&P 500; we are taking a +-2.5% range to this estimate.
- At the time of writing, the S&P 500 has a price-earning ratio of 18.9x. Hence, we created the analysis based on a synthetic bond with 19 years of maturity. We set the bond coupons equal to 6.095 (dividing the 12-month forward earnings per share of $175.12 by S&P 500 index price of $2873.34). The discounting yield used in this example is set to 2.48% which is a linearly interpolated average yield between 10- and 30-year US government bond yields. With this set of parameters, the interest rate sensitivity estimated for this synthetic bond is 12.9x.
- The infamous act of Congress that was passed in 1930 was known as the Smoot-Hawley Tariff Act. Eventually, the US hiked tariffs to as much as 60% on more than 20,000 imported goods.
Promotional 100% off StashAway Fees for MyPF Readers!
100% off fees for the first RM100,000 invested for 6 months for MyPF members with this MyPF exclusive link:
Signup for StashAway
Share with us your thoughts about this article in the comments below.


Leave A Comment