Amanah Saham Bumiputera (ASB) historical returns from the fund’s launch in 1990 to the latest returns in 2019.
Contents
ASB 2019 Returns
- Income distribution per unit: 5.00 cents and bonus of 0.50 cents.
- Total distribution amount: RM9.0 billion.
- Total unit holders: 10 million.
- Total units: 167.2 billion units.
- Dividend will be reinvested into additional units and automatically credited into the unit holders’ accounts on Jan 1, 2020.
- Lowest ever total historical distribution since fund inception amidst challenging environment where KLCI is one of the worst-performing at -7.2% YTD.
- PNB aims to accelerate diversification strategy across asset classes and increase foreign equity holding including UK, US, Europe, and emerging markets.
“As a result of financial market volatility and the ongoing US–China trade tensions, with the subsequent slowdown in global trade weighing on external demand and export performance in regional markets, the market environment become much more challenging in 2019. Notwithstanding this, ASB was able to deliver a total income distribution of RM9.0 billion in FY2019 out of its realised gains buffered by its increasing international investments as planned under PNB’s Strategic Asset Allocation framework.” ~ Tan Sri Dr. Zeti Aziz, PNB Group Chairman
ASB Historical Returns
ASB Historical Returns 1990 to 2019
| Year | Dividend (cents) | Bonus (cents) | Total (cents) |
|---|---|---|---|
| 1990 | 8.00 | 6.00 | 14.00 |
| 1991 | 8.50 | 4.00 | 12.50 |
| 1992 | 7.50 | 5.00 | 12.50 |
| 1993 | 9.00 | 4.50 | 13.50 |
| 1994 | 9.50 | 4.50 | 14.00 |
| 1995 | 10.00 | 3.00 | 13.00 |
| 1996 | 10.25 | 3.00 | 13.25 |
| 1997 | 10.25 | 1.25 | 11.50 |
| 1998 | 8.00 | 2.50 | 10.50 |
| 1999 | 8.50 | 1.50 | 10.00 |
| 2000 | 9.75 | 2.00 | 11.75 |
| 2001 | 7.00 | 3.00 | 10.00 |
| 2002 | 7.00 | 2.00 | 9.00 |
| 2003 | 7.25 | 2.00 | 9.25 |
| 2004 | 7.25 | 2.00 | 9.25 |
| 2005 | 7.25 | 1.75 | 9.00 |
| 2006 | 7.30 | 1.25 | 8.55 |
| 2007 | 8.00 | 1.00 | 9.00 |
| 2008 | 7.00 | 1.75 | 8.75 |
| 2009 | 7.30 | 1.25 | 8.55 |
| 2010 | 7.50 | 1.25 | 8.75 |
| 2011 | 7.65 | 1.15 | 8.80 |
| 2012 | 7.75 | 1.15 | 8.90 |
| 2013 | 7.70 | 1.00 | 8.70 |
| 2014 | 7.50 | 1.00 | 8.50 |
| 2015 | 7.25 | 0.50 | 7.75 |
| 2016 | 6.75 | 0.50 | 7.25 |
| 2017 | 7.00 | 1.25 | 8.25 |
| 2018 | 6.50 | 0.50 | 7.00 |
| 2019 | 5.00 | 0.50 | 5.50 |
| 2020 | 3.75 | 0.75 | 4.25 |
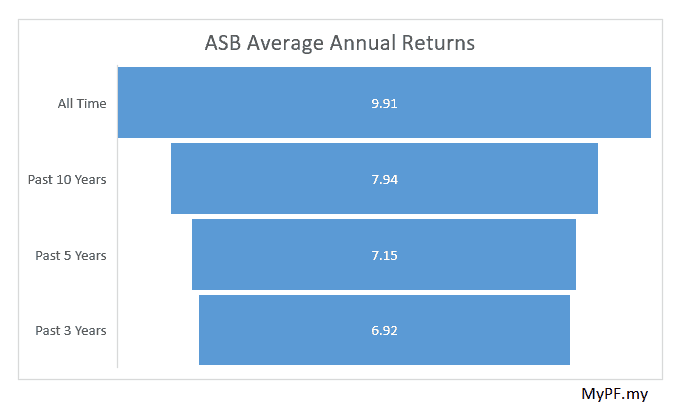
ASB Average Historical Returns
| Average Returns | Dividend (cents) | Bonus (cents) | Total (cents) |
|---|---|---|---|
| All Time | 7.84 | 2.07 | 9.91 |
| Past 10 Years | 7.06 | 0.88 | 7.94 |
| Past 5 Years | 6.50 | 0.65 | 7.15 |
| Past 3 Years | 6.17 | 0.75 | 6.92 |
“PNB will continue to navigate these challenging times, as we have done for more than 40 years, to ensure we continue to deliver
sustainable returns to our unit holders. We will continue to strengthen our investment portfolio in this challenging period via our diversification strategy, tighter risk management and enhancing our internal capabilities through a progressive organisational transformation plan.” ~ Tan Sri Dr. Zeti Aziz, PNB Group Chairman
You May Also Like
- ASNB declares total payout of RM9.0 billion for Amanah Saham Bumiputera (asnb.com.my)
- Should I take a loan to invest in ASB?
- How to get your ASB loan approved


I reviewed my ASW dividend calculation for the period 01 Sept 2018 – 31 Aug 2019. I have only made investments for this entire period, without any withdrawals (sell back). Based on the [(0.05/12) * lowest monthly balance], I do not get the same amount of dividend – it appears to be less, when it should be higher.
Has anyone ever checked their dividend calculations? Am I calculating correctly?
Best regards.
Due to covid19 pandemic
Can i transfer EPF to ASB using the i-akaun apps.