Amanah Saham Bumiputera (ASB) historical returns from the fund’s launch in 1990 to the latest returns in 2020.

Permodalan Nasional Bhd (PNB) just announced the lowest distribution in Amanah Saham Bumiputera (ASB) in 30 years, at 4.25 sen per unit.
This include 3.5 sen distribution and a 0.75 sen bonus for the year ending Dec 31, 2020.
Unit holders will also receive a special one-off “Ehsan” payment of 0.75 sen per unit for up to the first 30,000 units for its 30th anniversary.
This amount is definitely lower than last year’s total distribution of 5.5 sen per unit, with 5 sen distribution and a half-a-sen bonus. The payout for 2020 will be RM7.6 billion, with 10.2 million unitholders benefited from it.
Amanah Saham Nasional Bhd (ASNB) also announced an income distribution payout of 2.02 sen per unit or RM36.6 million for its unit holders. This means a dividend yield of 3.18% as at Dec 31, 2020.
Contents
Summary of ASB 2020 Returns
- Income distribution per unit: 3.5 cents and bonus of 0.75 cents.
- Unitholders will also receive a special one-off “Ehsan” payment of 0.75 sen per unit for up to the first 30,000 units for its 30th anniversary.
- Total distribution amount: RM7.6 billion.
- Total unit holders: 10.2 million.
- Total units: 173.2 billion units.
- Dividend will be reinvested into additional units and automatically credited into the unit holders’ accounts on Jan 1, 2020.
- Lowest ever historical returns in ASB’s 30 years history
- PNB noted that 2020 had been difficult with the world facing pandemic and economic crisis.
- PNB chairman, Tan Sri Dr Zeti Akhtar Aziz confident that their performance remained competitive compared with other low-risk investment instruments.
ASB Historical Returns
ASB Historical Returns from 1990 to 2020
| Year | Dividend (cents) | Bonus (cents) | Total (cents) |
|---|---|---|---|
| 1990 | 8.00 | 6.00 | 14.00 |
| 1991 | 8.50 | 4.00 | 12.50 |
| 1992 | 7.50 | 5.00 | 12.50 |
| 1993 | 9.00 | 4.50 | 13.50 |
| 1994 | 9.50 | 4.50 | 14.00 |
| 1995 | 10.00 | 3.00 | 13.00 |
| 1996 | 10.25 | 3.00 | 13.25 |
| 1997 | 10.25 | 1.25 | 11.50 |
| 1998 | 8.00 | 2.50 | 10.50 |
| 1999 | 8.50 | 1.50 | 10.00 |
| 2000 | 9.75 | 2.00 | 11.75 |
| 2001 | 7.00 | 3.00 | 10.00 |
| 2002 | 7.00 | 2.00 | 9.00 |
| 2003 | 7.25 | 2.00 | 9.25 |
| 2004 | 7.25 | 2.00 | 9.25 |
| 2005 | 7.25 | 1.75 | 9.00 |
| 2006 | 7.30 | 1.25 | 8.55 |
| 2007 | 8.00 | 1.00 | 9.00 |
| 2008 | 7.00 | 1.75 | 8.75 |
| 2009 | 7.30 | 1.25 | 8.55 |
| 2010 | 7.50 | 1.25 | 8.75 |
| 2011 | 7.65 | 1.15 | 8.80 |
| 2012 | 7.75 | 1.15 | 8.90 |
| 2013 | 7.70 | 1.00 | 8.70 |
| 2014 | 7.50 | 1.00 | 8.50 |
| 2015 | 7.25 | 0.50 | 7.75 |
| 2016 | 6.75 | 0.50 | 7.25 |
| 2017 | 7.00 | 1.25 | 8.25 |
| 2018 | 6.50 | 0.50 | 7.00 |
| 2019 | 5.00 | 0.50 | 5.50 |
| 2020 | 3.75 | 0.75 | 4.25 |
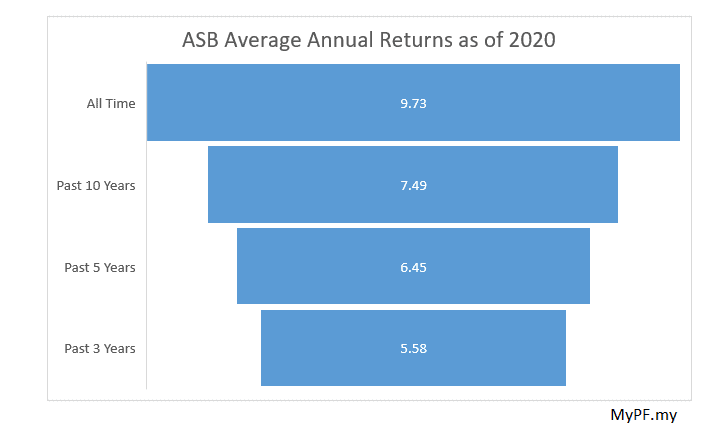
ASB Average Historical Returns
| Average Returns | Dividend (cents) | Bonus (cents) | Total (cents) |
|---|---|---|---|
| All Time | 7.70 | 2.03 | 9.73 |
| Past 10 Years | 6.66 | 0.83 | 7.49 |
| Past 5 Years | 5.75 | 0.70 | 6.45 |
| Past 3 Years | 5.08 | 0.58 | 5.58 |
“PNB will continue to remain focused on the execution of its long-term strategy. The positive results which we have seen from diversification will propel PNB to continue building a resilient investment portfolio, which would enable us to generate long-term sustainable returns to our unitholders,” – Ahmad Zulqarnain Onn, PNB president and group chief executive
You May Also Like
- How to Invest in ASB & ASM
- ASB Historical Returns from 1990 to 2019
- How to Get Your ASB Loan Approved
- Should I take a Loan to Invest in ASB?
What do you think of this year ASB’s return?


Leave A Comment